What's included
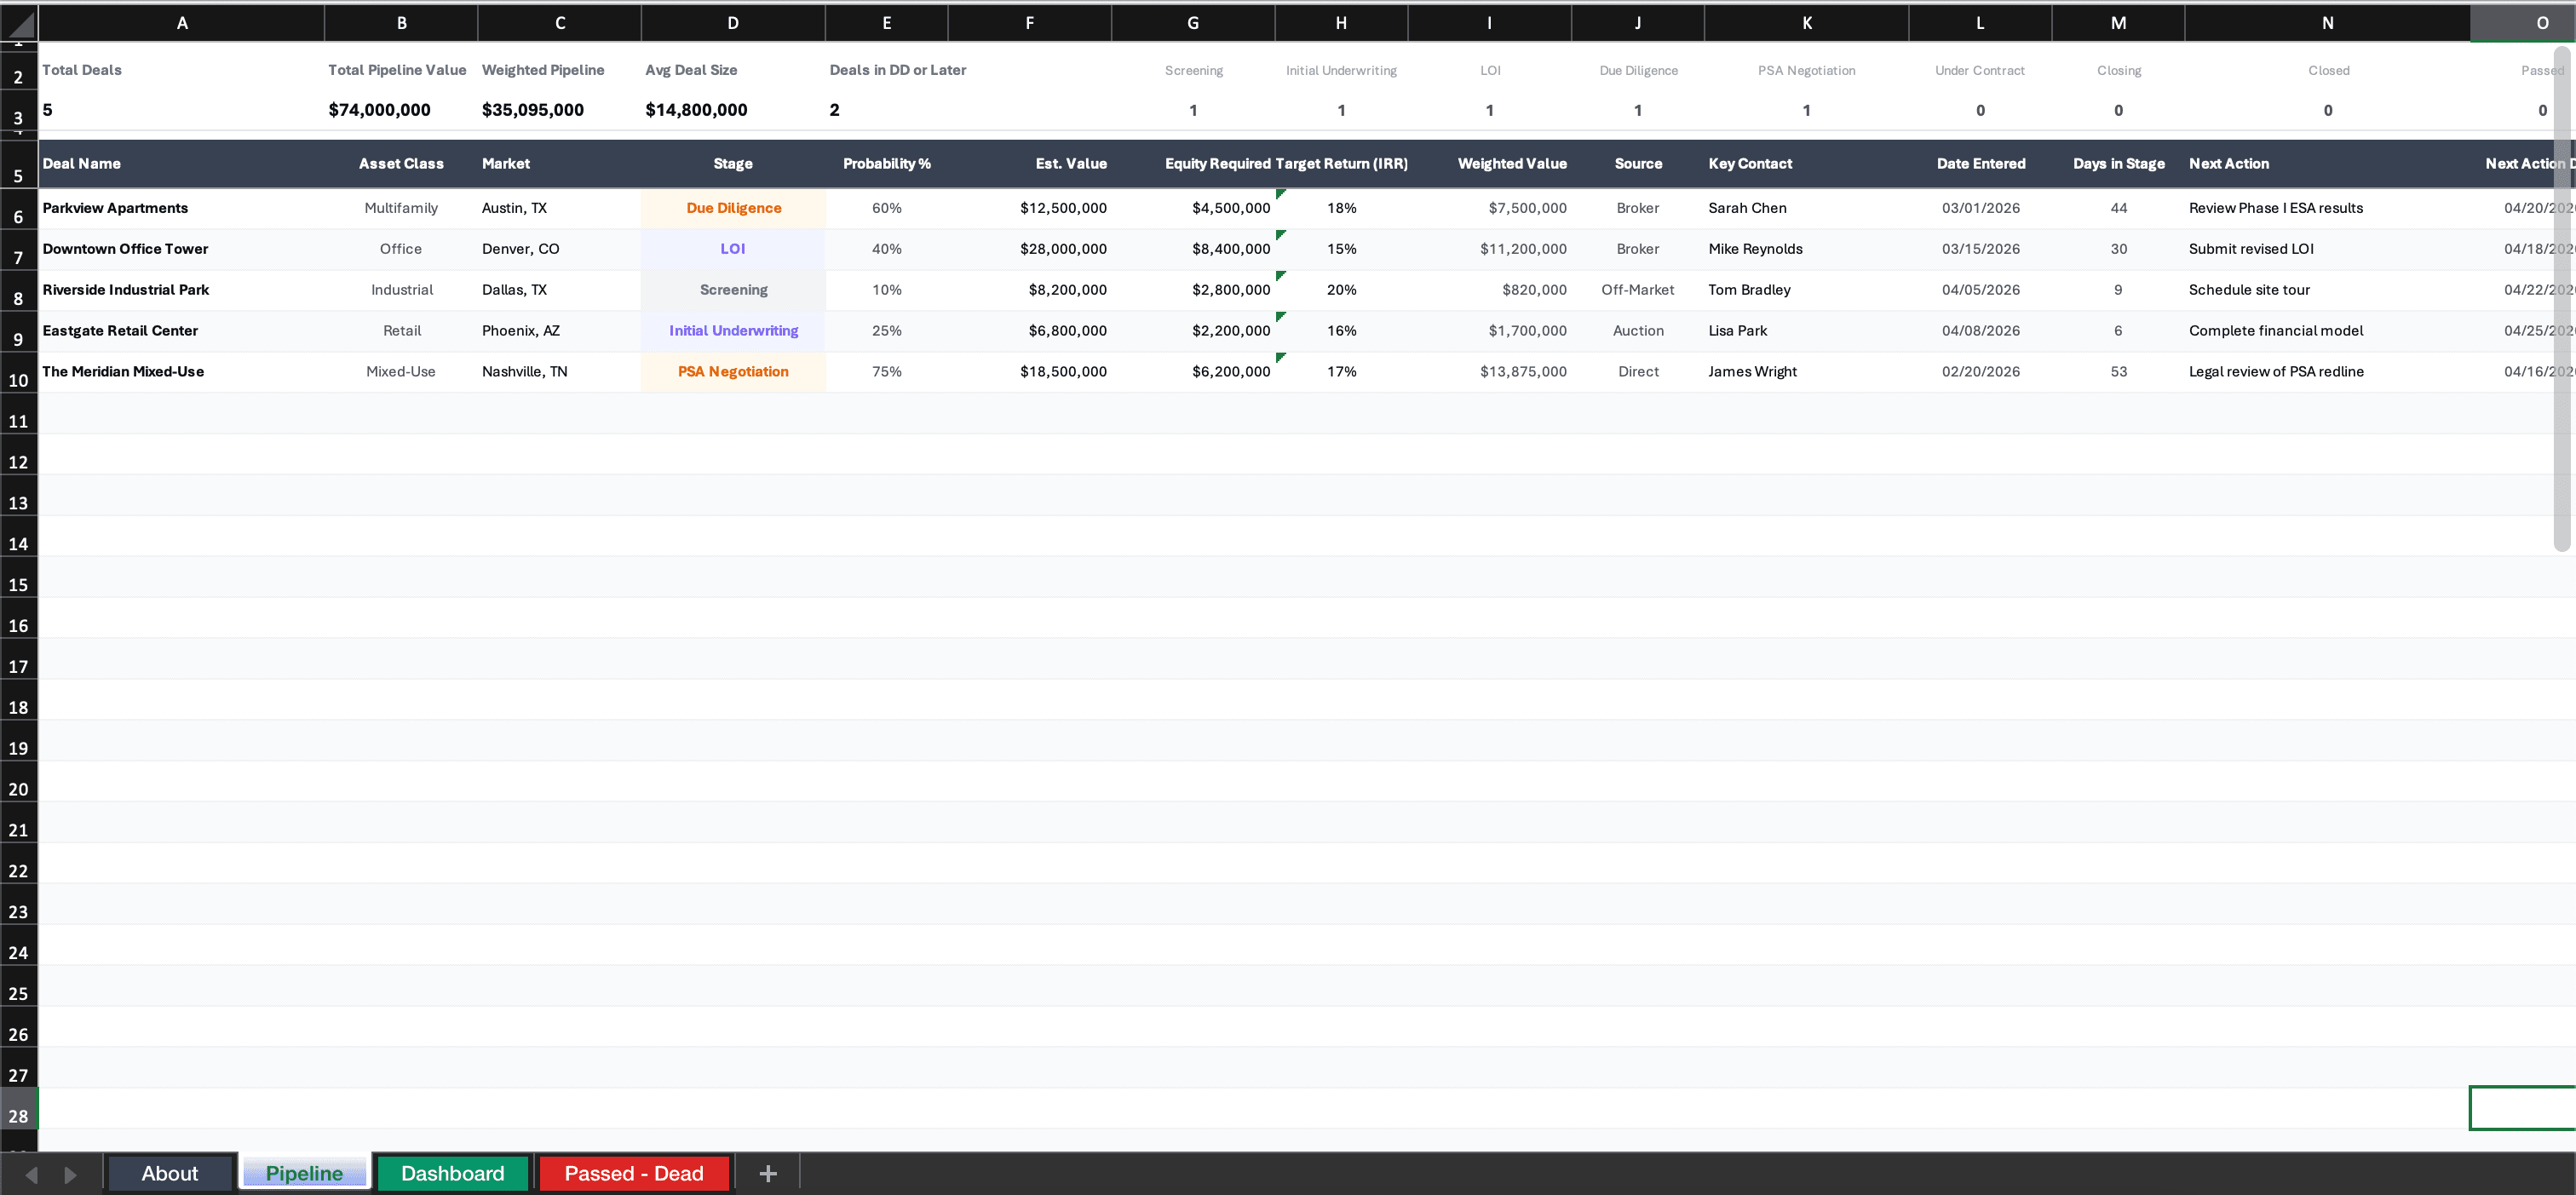
This Excel workbook contains 4 tabs built for CRE acquisition teams that need visibility into their deal funnel. The Pipeline Tracker tab logs every deal across 16 columns: property name, address, market, asset type, units/SF, asking price, price per unit (auto-calculated), deal stage, probability percentage, weighted value (auto-calculated), LOI date, PSA date, projected close date, days in current stage (auto-calculated), aging alert flag, and assigned team member.
The Dashboard tab displays conversion funnel metrics, weighted pipeline value, stage distribution, and aging alerts. The About tab explains column definitions and stage criteria. The Passed/Dead tab archives deals that did not advance, preserving your historical data for pipeline analysis.
Designed for acquisition teams tracking 10 to 100+ deals simultaneously across multiple markets and asset types.
Pipeline stages
The template includes 8 predefined pipeline stages with associated probability weightings:
- Screening (10%) — Initial review of the offering memorandum and high-level underwriting to determine if the deal fits your investment criteria.
- Initial Underwriting (20%) — Detailed financial analysis, market research, and preliminary due diligence before submitting an offer.
- LOI Submitted (30%) — Letter of intent has been delivered to the seller or broker. Awaiting response or negotiation.
- LOI Accepted (50%) — Terms agreed upon. Moving toward purchase and sale agreement execution.
- Due Diligence (65%) — PSA executed, inspection period active. Third-party reports ordered and underway.
- Financing (80%) — Loan application submitted, appraisal ordered, lender underwriting in progress.
- Closing (90%) — All contingencies cleared. Final document preparation and fund transfers in progress.
- Closed (100%) — Transaction complete. Deal moves to the archive with final metrics recorded.
Customize these stages and probability percentages to match your team's actual historical conversion rates for more accurate pipeline forecasting.
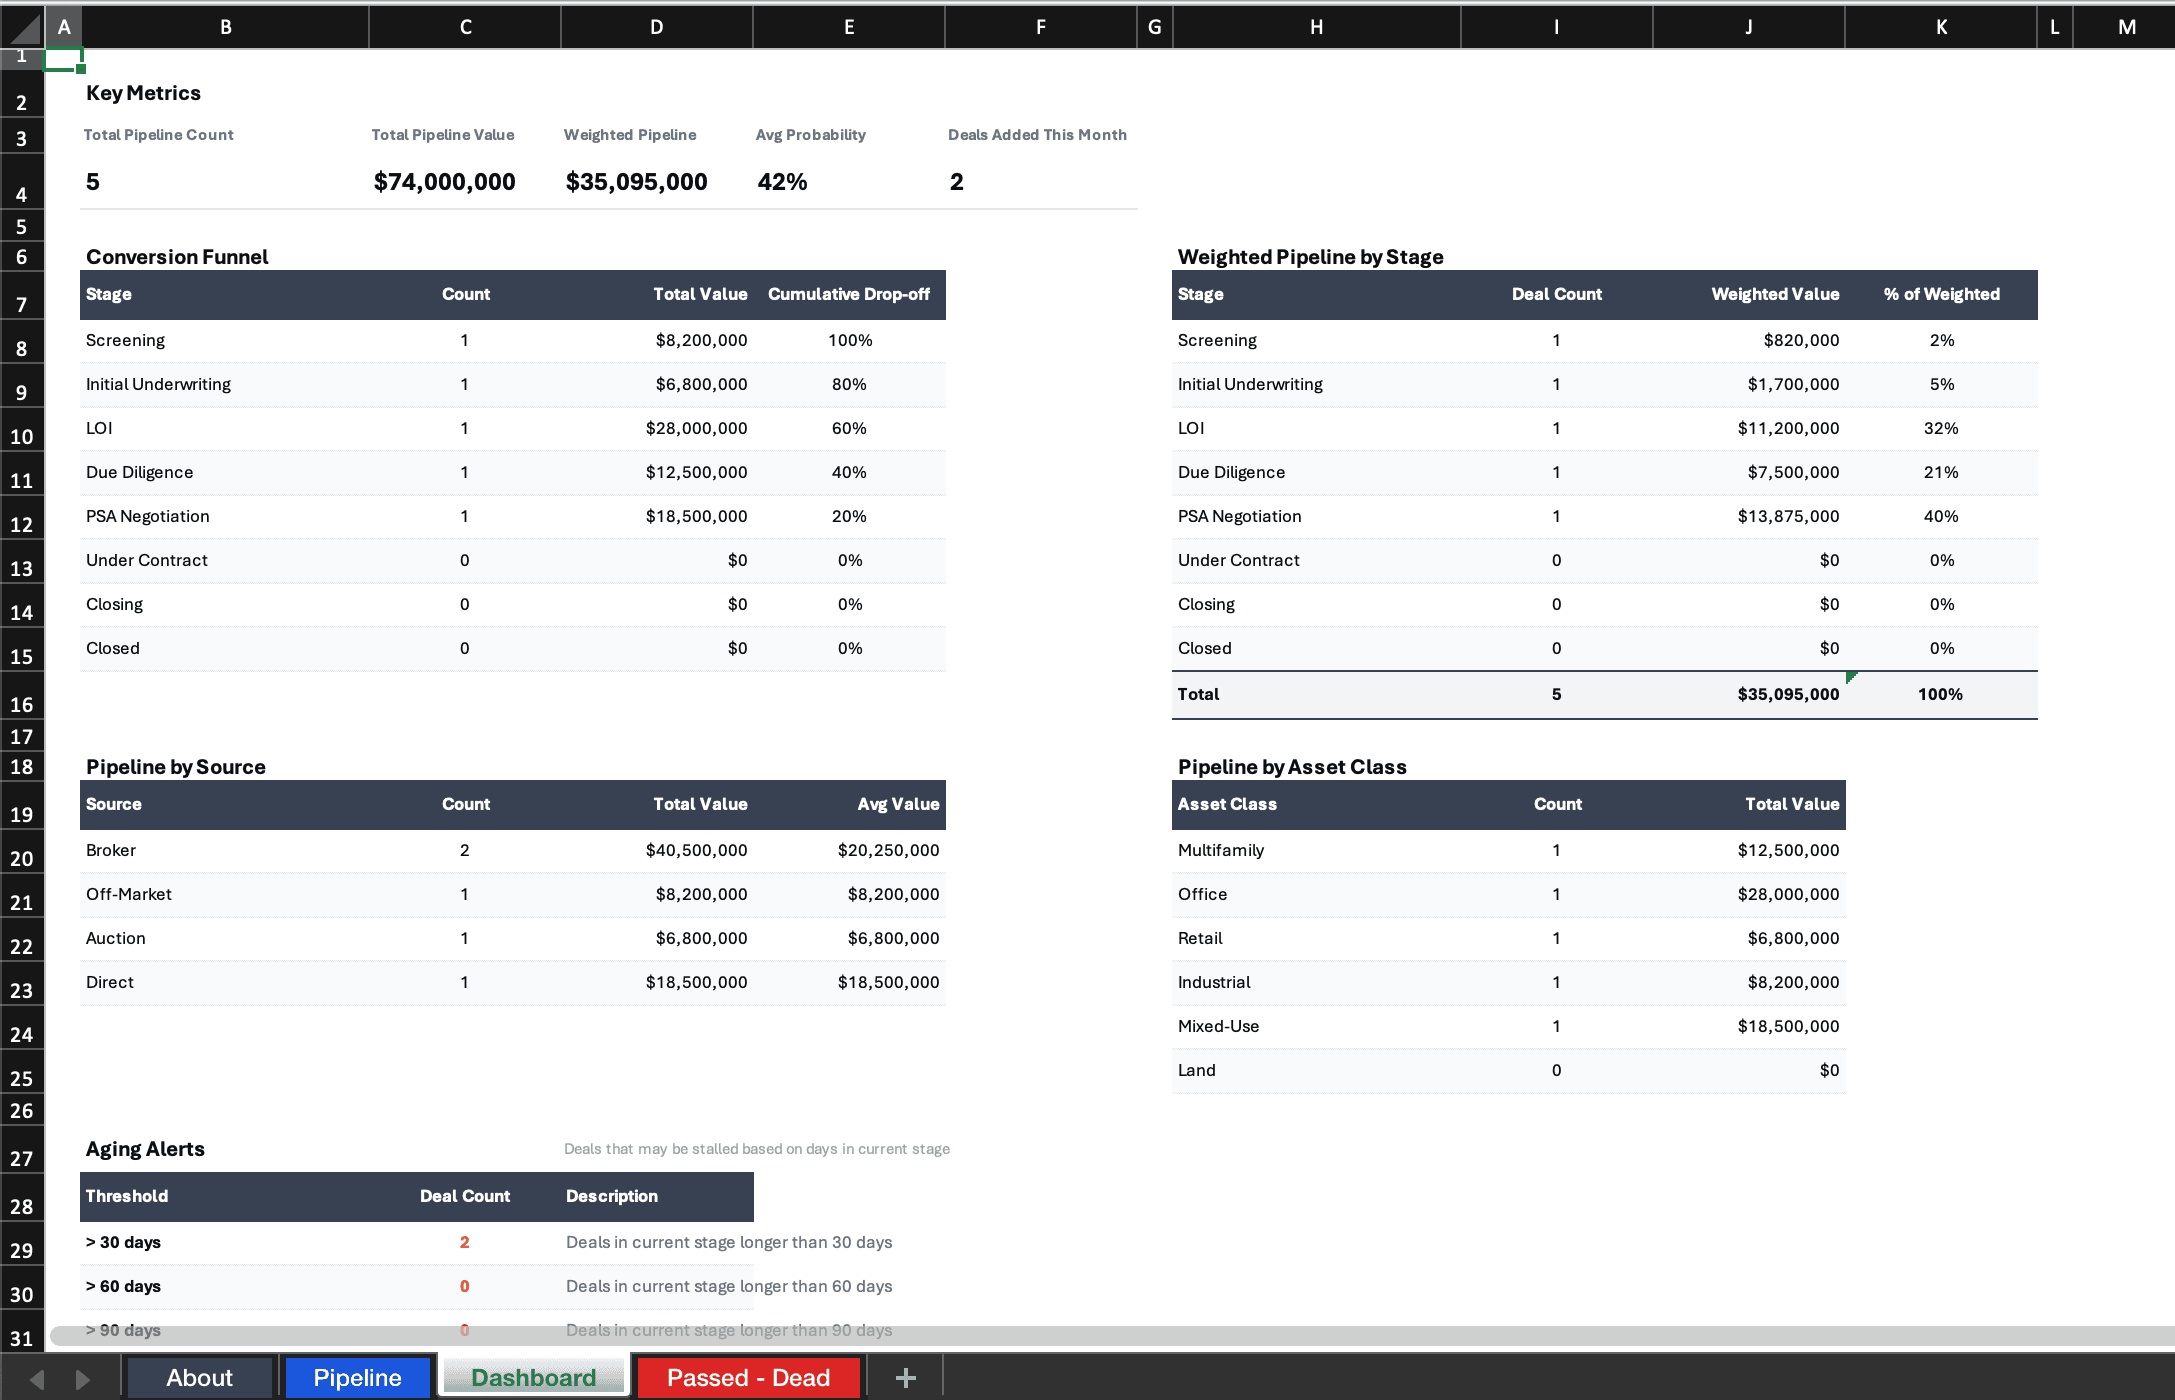
Dashboard analytics
The dashboard tab provides four key views of your pipeline health. The conversion funnel shows how many deals sit at each stage and the drop-off rate between stages, helping you identify where deals stall. The weighted pipeline value multiplies each deal's value by its stage probability to give you a realistic forecast of expected closings.
The aging analysis flags deals that have spent longer than expected in their current stage. This is one of the most valuable metrics in pipeline management because stale deals consume team resources without progressing. The stage distribution chart shows whether your funnel is balanced or overweighted at any particular phase.
All dashboard metrics update automatically as you modify the pipeline tracker. For teams that want real-time pipeline analytics without manual spreadsheet maintenance, MotionCRE provides the same metrics with automated stage tracking, deal workspaces, and team-wide visibility.
How to track deal probability
Probability weighting transforms your raw pipeline into a realistic closing forecast. Instead of looking at total pipeline value (which overstates your position), weighted value accounts for the likelihood that each deal actually closes based on its current stage. A $10M deal at the Screening stage (10% probability) contributes $1M to your weighted pipeline, while the same deal at Due Diligence (65%) contributes $6.5M.
Start with the default probability percentages in this template, then adjust them over time based on your team's actual conversion data. If your team historically closes 40% of deals that reach LOI Accepted (rather than the template's default 50%), update accordingly. The more your probabilities reflect reality, the more useful your pipeline forecasts become.
For a simpler tracking approach, see our CRE deal tracker spreadsheet. When deals reach the due diligence stage, use the multifamily DD checklist or closing checklist to manage execution through close.
Frequently asked questions
How do you build a CRE acquisition pipeline?
Start by defining clear pipeline stages that match your investment process, from initial screening through closing. Log every deal as it enters the pipeline with consistent data: property details, financial metrics, stage, probability, and assigned team member. Review the pipeline weekly to advance or remove deals. The discipline of consistent tracking is what separates high-performing acquisition teams from those that lose deals to disorganization.
What stages belong in a deal pipeline?
A typical CRE acquisition pipeline includes 8 stages: Screening, Initial Underwriting, LOI Submitted, LOI Accepted, Due Diligence, Financing, Closing, and Closed. Some teams add a Pre-Screening or Market Survey stage at the top of the funnel. The key is that each stage has clear entry criteria and the whole team uses the same definitions.
How do you track deal probability in CRE?
Assign a probability percentage to each pipeline stage based on historical close rates. A common framework: Screening at 10%, Initial Underwriting at 20%, LOI Submitted at 30%, LOI Accepted at 50%, Due Diligence at 65%, Financing at 80%, Closing at 90%, and Closed at 100%. Multiply each deal value by its stage probability to calculate a weighted pipeline value that reflects realistic expected outcomes.
Download this template
Enter your details below to download.
Excel format · No account required